August 18, 2021: Curve vs Balancer 🦙⚖️
Benchmarking Curve's Tripool Against Balancer's New MetaStable Pools


Balancer launched metastable pools, including an “imitation is the sincerest form of flattery” DAI-USDC-USDT pool reminiscent of Curve’s TriPool. No surprise other protocols want their own TriPool. It essentially has become the foundation for all stablecoins and therefore all of DeFi.
Lest you read too much into the rivalry, Curve’s chad founder weighed in to comment that there’s no whiff of copyright infringement, a la Saddle.
At this point, Curve’s TriPool is valuable largely for its role in supporting the entire ecosystem of other Curve pools, so it would be unlikely that a competitive TriPool would eat Curve’s lunch.
There’s a reasonable degree of overlap between the two protocols. Balancer has pools with the CRV token, and the new TriCrypto pool has been likened to Balancer pools in terms of its UX and impermanent loss.
Nonetheless, we wanted to take a look at how one might benchmark, or possibly even arb, these two Tripools against each other. Here’s our methodology.
For balances of $1K through $10MM, at steps of 10^n, we calculated the gain or loss one would experience if they moved between the six possible routes between DAI, USDC, and USDT. We calculated the output amounts for both Curve and Balancer and compared these pools against each other.
For Curve, we could easily toss together a simple Brownie script because Curve is a dream to program against. We used the Curve exchange contract to estimate the amounts, and also verified the outputs were accurate by running test transactions on a forked mainnet environment. It’s an easy script, you can download it for yourself here (just make sure to set the contract aliases).
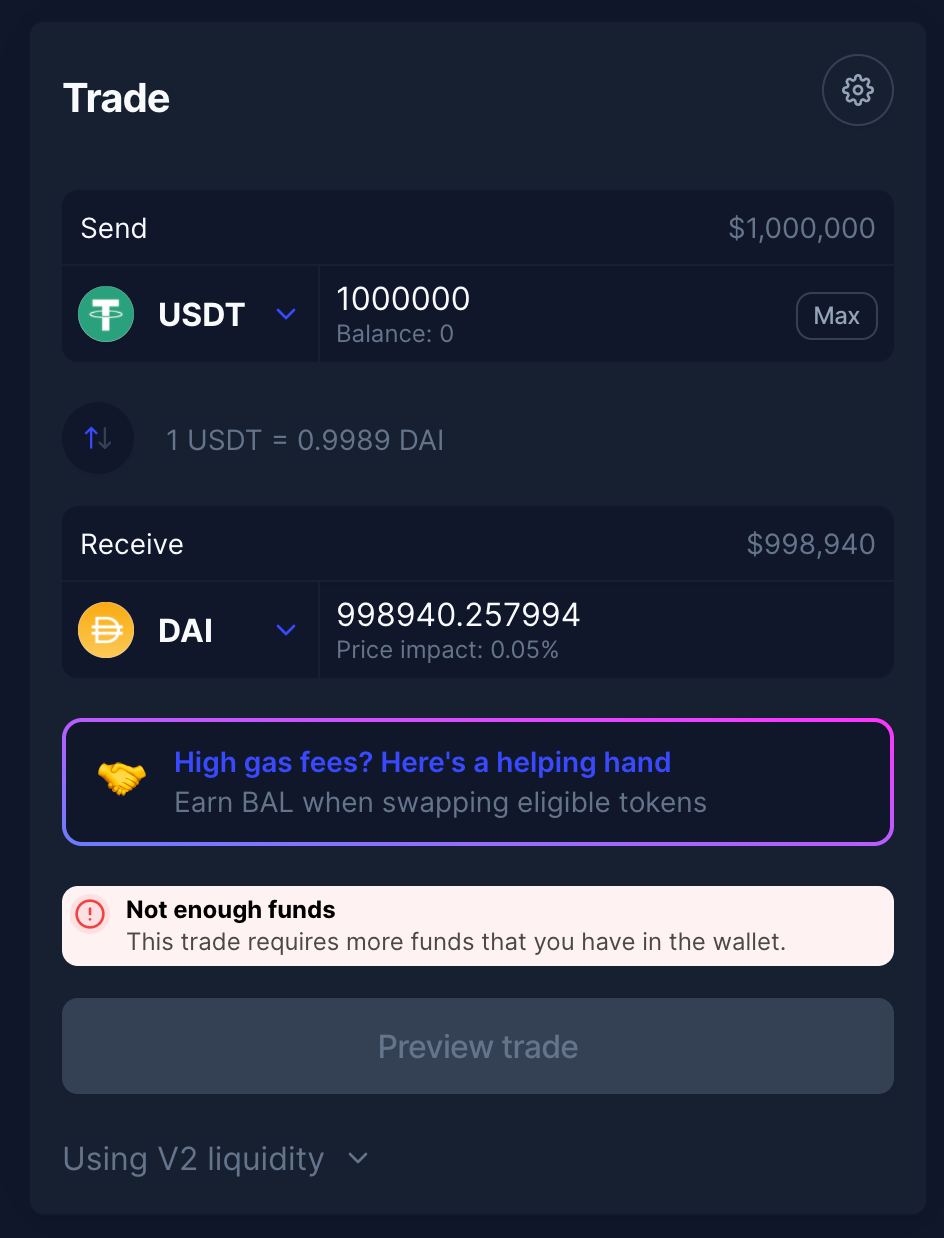
I spend a few minutes trying to run the Balancer transactions through Brownie, but their smart contracts are not so straightforward to work with. It was quicker to simply plug the numbers into their web interface and copy the output estimates. Unfortunately I could not verify their accuracy.
The results are as follows:
The leftmost column shows the transaction value and the second column shows the route used. The next two columns show the output value of the trade. The first two columns of bars illustrate the bonus (green) or loss (red) in the trade in percentage terms. The final set of bars illustrates the relative % bonus one would get for using Curve, with green signifying Curve would perform better and red indicating Balancer would perform better.
With the exception of DAI to USDT, transacting through the Curve 3pool was better by about 2 basis points for amounts under a million. The DAI to USDT bonus is presumably the result of a temporary imbalance that may differ if you ran it again at a later time. Both Curve and Balancer had a bonus for transacting between DAI to USDC at the time of measurement, although this bonus disappeared somewhere above $1MM.
Whales have a clear advantage on Curve for larger trades. Transactions at about $1MM improved to a 3 basis point advantage for Curve. By $10MM, this escalated to 6.5 basis points. The DAI to USDC bonus also persisted for trades up to $10MM.
This whale advantage is no doubt due to the amount of liquidity in the Curve 3pool, which has about $1.5 billion sitting around. Balancer has a bit under $200MM. It’s been generating a healthy 12% APR though, so perhaps this is positioned to achieve more liquidity and even out the performance between these pools.
One final note — Balancer is offering a great gas rewards program at the moment. It appears that trades through the Balancer DAI-USDC-USDT would be eligible for this, returning some amount of $BAL for every trade. We did not include these effects in our above calculations because we wanted to gauge the underlying efficiency, not the effects of a presumably temporary program.
If you wanted to gauge this difference, it would be easy enough to factor in these results by noting the difference between the Raw Amounts columns. It’s not clear what volume of $BAL would be returned, but assume it’s on the order of $50. This would tip the advantage to Balancer for shrimp (trades under $1MM), whereas for whale trades ($1MM+) the effect of slippage would make Curve preferable.
As we commonly say, whales don’t care about gas prices! Pain at the pump is only for the poor.
For more info, check our live market data at https://curvemarketcap.com/ or our subscribe to our daily newsletter at https://curve.substack.com/. Nothing in our newsletter can be construed as financial advice. Author is a $CRV maximalist, has no stake in $BAL.


