August 23, 2023: $crvUSD Loan Analysis 💵📊
Visual breakdown of $crvUSD loss metrics over two months
We have now two months of data of $crvUSD usage over four markets. Let’s crunch some numbers!
All data, charts, and scripts to generate are available in GitHub. We encourage you to use the scripts to repeat this yourself, learn how to crawl data from crvUSD, and improve the code for your own purposes. We make no claims that this is perfectly free of errors, especially since we used ChatGPT to supplement some of the tedious bits of code, which is almost more work than it’s worth these days.
We’ll caution upfront that this data is not always straightforward to pull directly in this manner — for example the way in which loss % is calculated requires pulling with block-by-block resolution to get it perfect. We could only pull a sample of 100 blocks worth of data per user, which is roughly a daily snapshot per user. Data is therefore inaccurate when users were actively rebalancing more than once per day, but a spot check of such users suggested the data was close within a reasonable ballpark.
All data is therefore indicative and should certainly be treated as educational, not the basis for financial advice. We last pulled this data on August 21, at which time there were four markets, representing over $100MM in collateral backing a $121MM market cap for $crvUSD. We observed 686 unique users over this period.
Markets
We’re dealing here with four markets, of which wstETH was by far the most popular.
The sfrxETH market was capped at a lower ceiling since launch, which somewhat prevented users from doing too much activity.
The number of loans naturally has fluctuated throughout time. Here we plot the total number of loans for each market against the collateral asset’s price.
Amidst the most volatile periods this number would tend to see an uptick in volatility, due to users either closing their position or being forced out of their position.
We note that the data covers a range starting with block 17432225 through the following block:
sfrxeth    17967166
wbtc       17836546
weth       17832443
wsteth     17957618
As seen in the price charts above, this means that the most recent market plunge of this past week was unfortunately not captured in this data set.
Losses
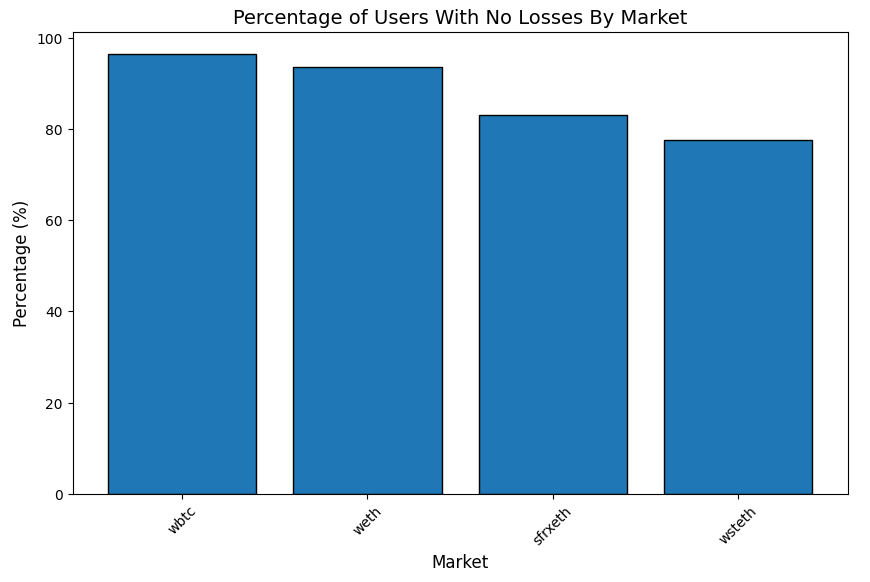
The really good news for users is that the supermajority of users avoided any losses in every market.
WBTC users were the most diligent at not risking a single satoshi, which you can somewhat see in the following plot of collateral.
In contrast, the relatively risk seekers in the wstETH market saw the most users in a loss.
For those users who did fall into range where their collateral began getting converted, how did they fare?
We can see the overall story as a series of lines.
For the users in wstETH, the chart is indistinguishable from spaghetti. It’s not a great visualization, as it tends to show off the most extreme loser in each category. A better way to see the story is a histogram — where we see that the supermajority of users are safe.
Once you prune the users who have no losses, it’s still exceedingly concentrated towards lower losses.
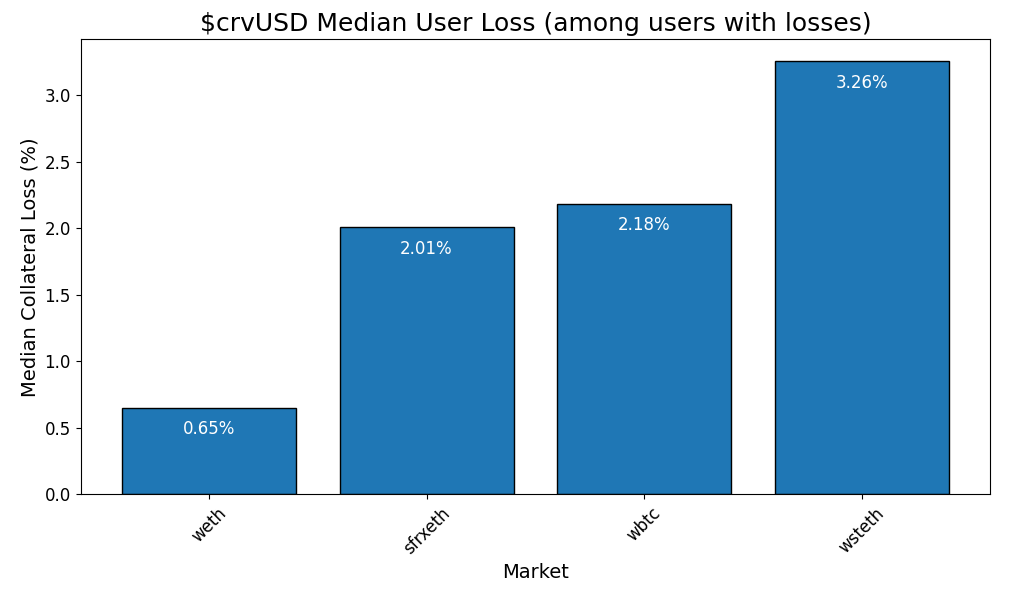
Globally it works out to a median loss of just 2.07%, broken down here by market:
Number of Bands
Users can customize the number of bands over which they distribute their collateral. A higher “N” value is safer, as the collateral asset price must sweep through a larger range of bands in the liquidation process.
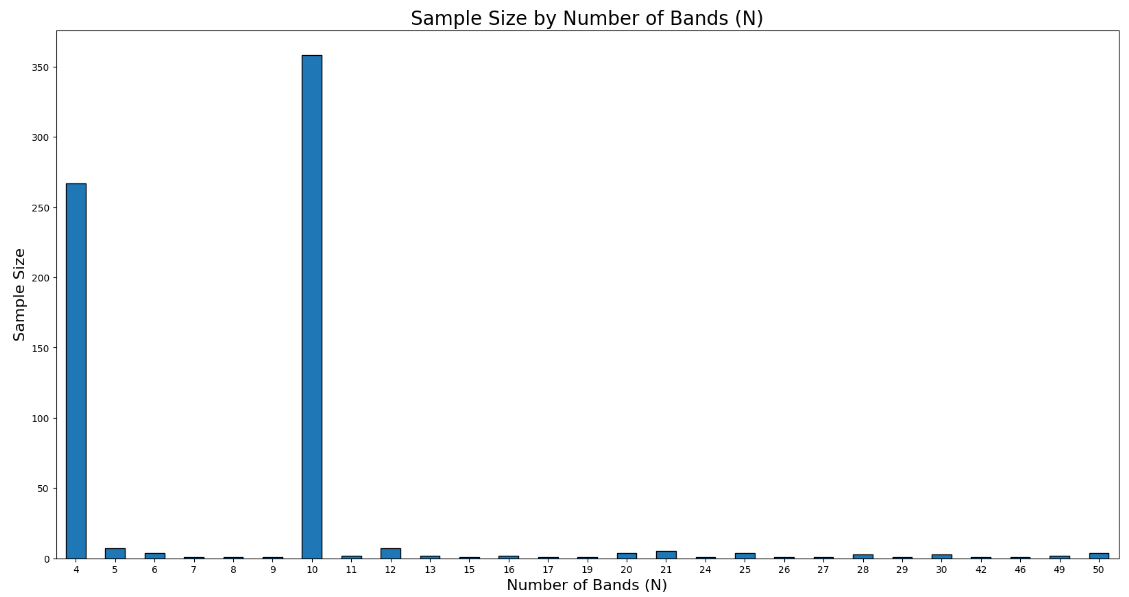
The crvUSD UI defaults to 10 bands. Since the ability to change this number is hidden by default, and the concept of “bands” may be opaque to users, one would expect, correctly, that the typical user would select “10”
Still, a significant number of users found their way into the riskiest possible value of “4” bands. While there was a smattering of loans across other values, the sample size was too insignificant to draw statistical conclusions, so we focus hereforward on users in “4” or “10” band range.
Globally, the users with the more conservative “10” bands fared better, though the supermajority of users in both cases avoided any losses altogether.
When users did suffer losses, these losses were more pronounced among users in the “4” band range. Here a boxplot is helpful to show off the range of losses among these users.
Here the horizontal line in the center is by far the most instructive value. The median loss among users in 4 bands is 3.61%, while users in 10 bands were at just 1.30%
Health
How did users do at maintaining their loan health? It’s actually quite tough to tease much of value out of this.
You may think you can observe a trend in the overall graph below.
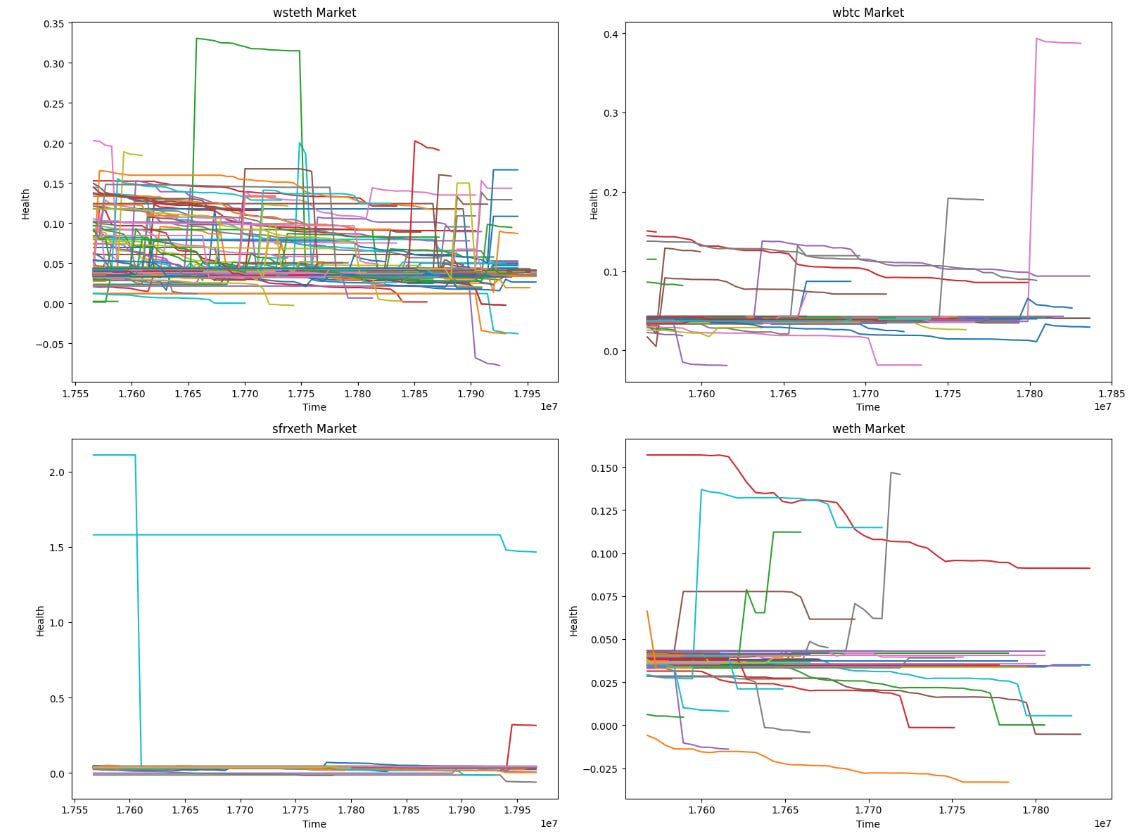
But this is mostly caused by users entering and exiting positions, which tend to cause massive fluctuations. The following spaghetti showing individual users’ health over time somewhat shows off how user positions can cause such fluctuations.
Additionally, the boxplot of ranges of health don’t say much because some users have such an absurdly high health factor as to render the plot meaningless.
You have to prune outliers to get any sense of what’s happening, where basically we see that users in the more conservative "10” bands actually tend to opt for a lower health score, but appear to suffer less fluctuation of health.
Discussion and Conclusions
The primary conclusion we draw from the above is that the touted improvements in the liquidation mechanism of $crvUSD are indeed substantial. Over 80% of users manage their loan in such a manner that they never see this mechanism in action.
Among the minority who take losses, the typical loss is just 2.1%. For users who follow the default recommendations, this loss is a mere 1.3%, while the hardcore degenerates who take the riskiest positions tend to suffer only 3.6% in losses.
We hope to rerun this analysis and focus on the recent market drop and post it as an addendum. However, the data takes a long time to pull (wstETH has so many positions that it must be run overnight), limiting the ability to rerun these analyses too often.
Additionally, towards the end leverage was added, but none of this got explicitly explored in this dataset, as it’s not straightforward to pull from analyzing loan positions. We hope to tag loans created using this feature and incorporate this into future analysis.
Supplemental Resources: https://github.com/zcor/crvusd/


Excellent
What's the average loss for loans on Aave/Compound though? Need to compare it to that to see if it's an improvement. (Probably can't use median since it will likely be 0 loss on those other protocols.)