June 12, 2023: Benchmarking $crvUSD 💸📈
With a few weeks of data, how does $crvUSD stand up to other stablecoins?
Curve keeps posting chart pr0n about $crvUSD.
They can’t keep getting away with it! Can’t somebody do something?
The charts look gorgeous in a sort of “eat your heart out, hockey sticks” sort of way. Yet in a vacuum they really tell us much. They only really tell us the lines are either up only (market cap) or flat (peg).
With nearly a month of data, how does $crvUSD benchmark against other stablecoins?
Summary
TL/DR: $crvUSD is early, but stacks up strongly in terms of peg and utilization rate. At the moment $crvUSD is experiencing rapid growth, so recommended to revisit these figures once the stablecoin’s growth begins to plateau.
Methodology
We’re keeping our methodology as dirt simple as possible, for the sake of transparency and reproducibility. We’re pulling almost everything directly from Coingecko so anybody may replicate this at home.
Specifically, we downloaded CSVs of historical data from 10 stablecoins as per the following: https://www.coingecko.com/en/coins/crvusd/historical_data#panel
The one exception is that CoinGecko does not have data on $crvUSD market cap, so we created a simple Dune Dashboard to pull the data on-chain, thanks to Dune’s new free tier plan allowing for csv exports.
Of course, the data we have here is a small sample size — with less than one month of data, and $crvUSD holding a very small footprint relative to other stablecoins, note that everything that follows carries a hefty asterisk.
We may take another look at this when we have more data, but for now it’s our first cut at benchmarking $crvUSD against other stablecoins.
The raw data is public and plotted using a simple and publicly available Jupyter Notebook, so anybody who likes can work with the data themselves. Enjoy!
Peg
While Curve keeps posting the chart of $crvUSD clinging tightly to $1, we wanted to see how precisely the peg stacks up relative to other stablecoins.
Within this period, nearly all stablecoins sit within the same horizontal mess of colored lines, except the lofty $LUSD.
Just yesterday we saw a very brief dip in $TUSD and $USDD, so we have a good window into how this affected $crvUSD ($TUSD being one of $crvUSD’s peg keepers). Fortunately, $crvUSD has mechanisms to protect against one of its peg keepers losing peg, and in this situation it recovered quite quickly.
The mess of colored lines tell us a little bit, but from this tangle of data we can compute some metrics on each coin’s peg. We can take the daily data and compute a Mean Absolute Error (relative to $1) for each stablecoin.
Expecting nothing in the way of reciprocity, we’ll nonetheless throw a bone to $LUSD and present this instead as a standard deviation, which better adjusts for $LUSD floating above peg.
In both cases, the biggest winner in this window is $DAI, followed by 1:1 backed stablecoins $USDC and $USDT. Paxos’s $USDP also sits very close to this class of stablecoins in both cases.
Moving to the next tier, $crvUSD sit atop the rest of the pack in terms of price stability. Albeit, it’s way too early in its life cycle to take a victory lap, but definitely worth keeping an eye on this metric to see if it the peg remains so tight as the stablecoin scales. Some prognosticators actually expect this may tighten if Peg Keeper pools gets more liquidity (tougher to splash the pool), or we may see the opposite effect if a larger market cap puts the coin into hackers’ crosshairs.
Finally, while we’re focused on prices, let’s plot a correlation table to see how the stablecoins move relative to each other.
Tough to pick out much meaningful from this, but we see that the price of $crvUSD was unexpectedly most tethered to $USDD for the month, followed by $USDT and $USDC.
Utilization
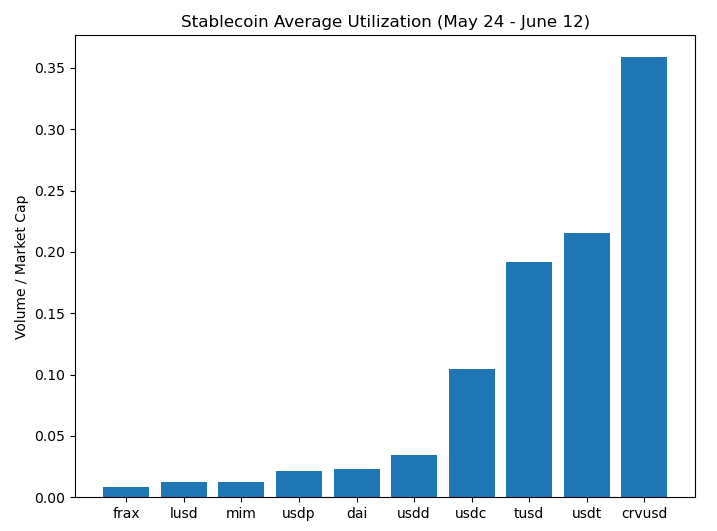
Coingecko has data on trading volume, so we can try to get a sense of how much these stablecoins actually get put to use.
However, we’re going to have to normalize it a touch, otherwise we don’t see anything except complete and utter Tether dominance, partly the obvious repercussion of America’s asinine war on crypto.
Above, we noted that we pulled total market cap data for $crvUSD directly from on-chain data, since CoinGecko did not have this data available. Using this data, we can divide volume by market cap to get a measure of actual utilization.
On this metric, $crvUSD compares quite favorably. It looks phenomenal for $crvUSD, but bear in mind this comes in a growth phase for $crvUSD. We might very well expect the new $crvUSD that gets minted immediately gets traded somewhere (usually Conic at the moment), and this activity possibly inflates utilization. Better to revisit this at whatever point the coin exits growth phase, but it’s a promising start.
Breaking this out to its daily graph shows that some of this heavy utilization is the effect of heavy trading on the 11th, where $TUSD dipped in price. Yet throughout the entire period $crvUSD sat on the higher side along with Tether. Worth watching.
Market Cap
Once again, it’s Tether’s world.
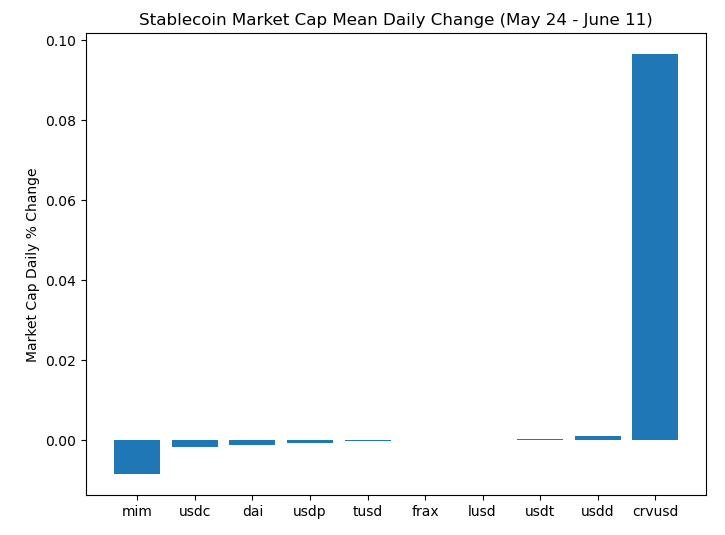
Except, however, if you want to look at how this market cap is actually changing. On this front, the daily growth of $crvUSD is astronomical.
It’s a nice story, but we interpret this mostly to mean that all the above data is going to be tough to compare in an “apples to apples” fashion until $crvUSD discontinues its relativistic speed of growth.
Conclusion
$crvUSD is early and still experiencing rapid growth. The growth rate cannot continue at a ~10% daily clip forever, so it will be useful to keep an eye on metrics like peg strength and utilization and observe any changes when growth inevitably tapers.
It would also be productive to pull this data not from the CoinGecko daily but direct from on-chain data, to reproduce this using data on a finer timeframe than a single day.
Additional metrics which were not considered in this analysis which would be useful to generate for future analyses:
Resilience: (how quickly does each stablecoin restore peg after volatility)
Frequency of Deviation: (how frequently does each stablecoin move beyond some threshold)
Market Correlation: (which stablecoins are susceptible to movements in other assets like ETH price)
Capital Efficiency: (the third prong of the so-called stablecoin trilemma)
What more would you recommend? Drop your thoughts in the comments!


