
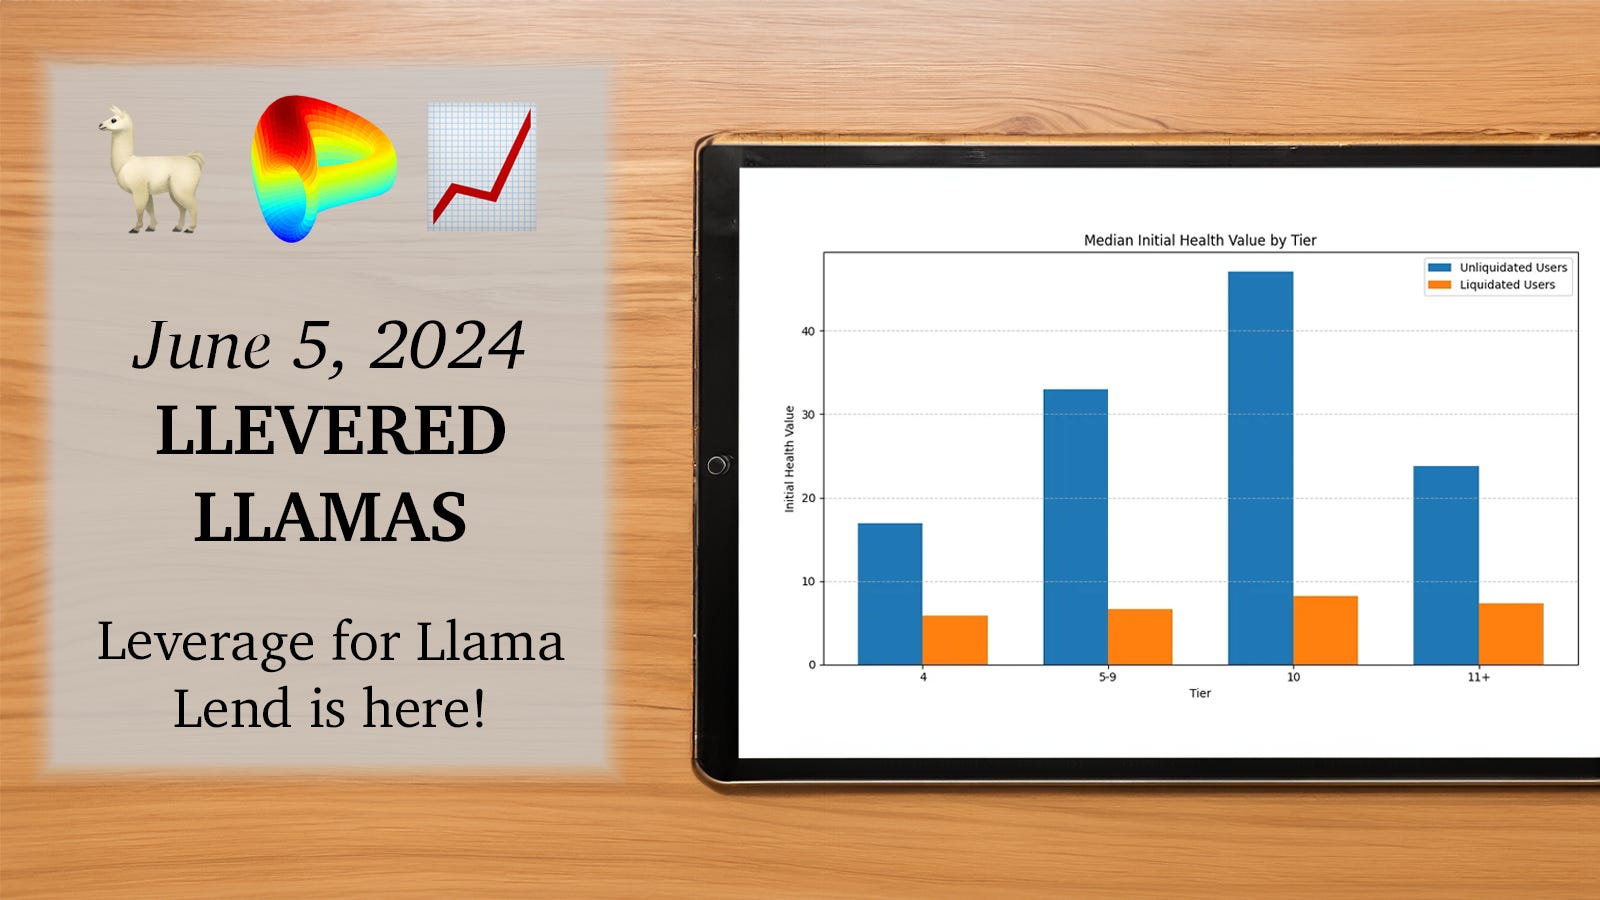
June 5, 2024: Llevered Llamas🦙📈
Leverage for Llama Lend is here!

OK degens, time to degen…


To celebrate the launch of leverage on Llama Lend, and to give you a bit of an idea what to expect, we present some high-level summary stats on how users have used $crvUSD and Llama Lend on mainnet to date.
We also provide all the code so you can replicate this yourself, complain about the methodology, and run your own analyses!
Methodology
This GitHub repository includes all the scripts, and data we used to generate the charts.
To replicate, follow the scripts in numerical order in the scripts directory:
Scrape log events from Etherscan API to capture every loan
Parse the output data to determine the status and key timestamps for each loan
Pull snapshot data throughout the lifetime of each loan (uses Ape, but very slow).
The scripts reference each data file output by the prior script and must be updated. We included our output data in the data directory, and the Jupyter Notebook shows the generation of all the charts below.
The third step was completed but was only superficially used in our analysis. The dataset is included in Github repository so other data scientists and ChatGPT whizzes can play with the dataset on their own.
Results
1. User Fate
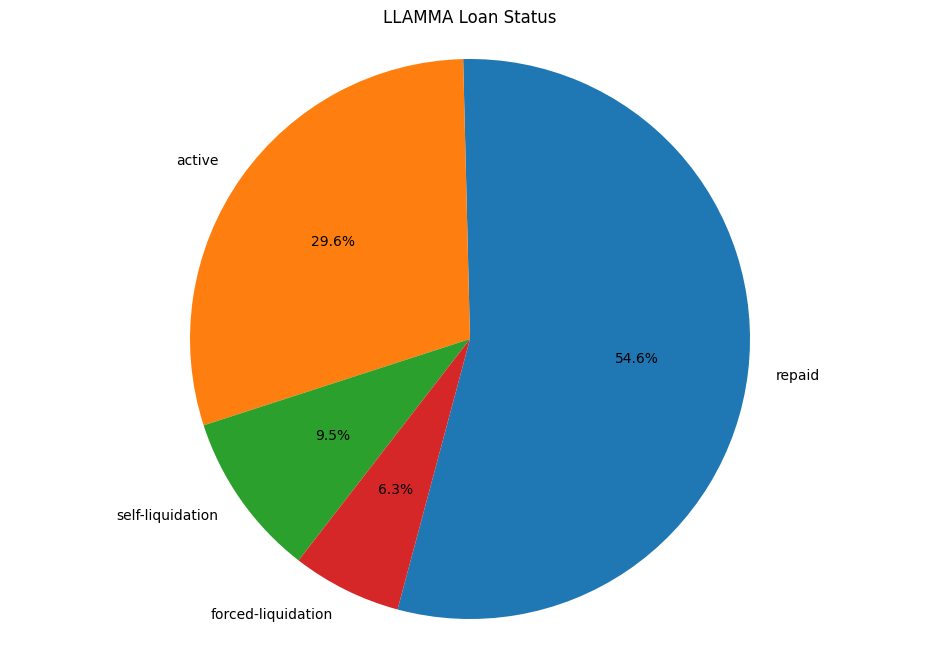
To give a sense of the universe, most $crvUSD and Llama Lend loans end up repaid, or when underwater then self-liquidated. Of all Llama Lend loans, 7.3% end in a hard liquidation. Of course, this simplistic chart doesn’t quite tell the whole story.
2. User Fate by Market
The full story is quite complex to tell though, because each market is quite different. Users are a lot less likely to get themselves liquidated in BTC-based markets than ETH-based markets.
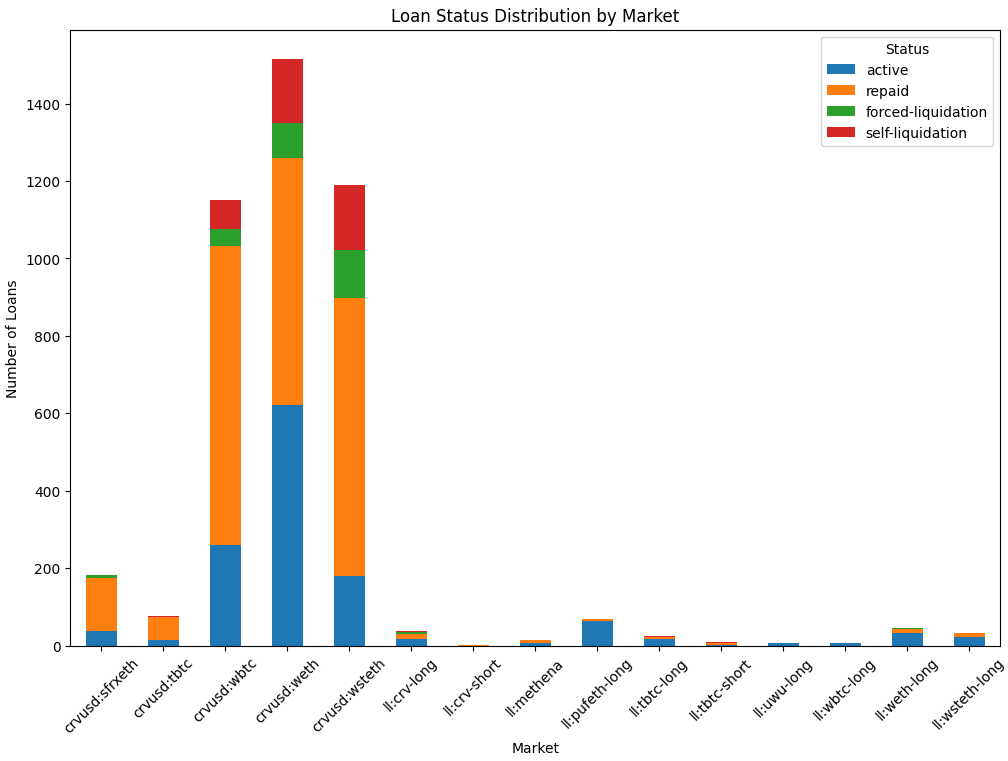
crvUSD has been in existence for a lot longer, has survived multiple market cycles, and has had leverage in place for a lot longer. Llama Lend is a blip.
One interesting thing to note is that crvUSD users generally were more likely to see their loan end in liquidation. If you can tease out how much of this was because of other factors (new tech, differing market cycles, etc) you could claim everything leftover is the difference of leverage. (Note that it’s not straightforward to tease out data on which users use leverage.)

3. Loan Fate by Number of Bands
One easy way to look at this is simply the number of bands the user had, and whether or not that loan ended in liquidation (both self-liquidation and forced liquidation)
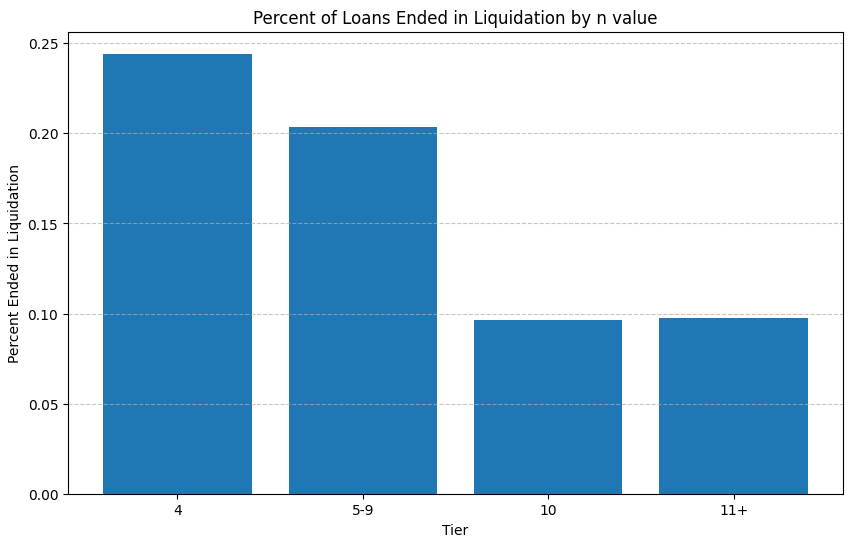
We group the tiers this way to get enough sample sizes, as most loans are in the risky n=4 state, followed by the default n=10.
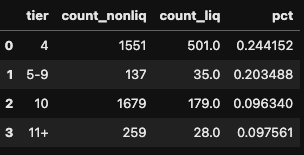
We see that users who picked just 4 bands were 2.5x more likely to be liquidated. But it’s not strictly safe to conclude this is necessarily due just to the number of bands they select. There’s an additional factor of the loan’s collateralization, and we see risky behavior tends to beget risky behavior…
4. Behavior: Health and Bands
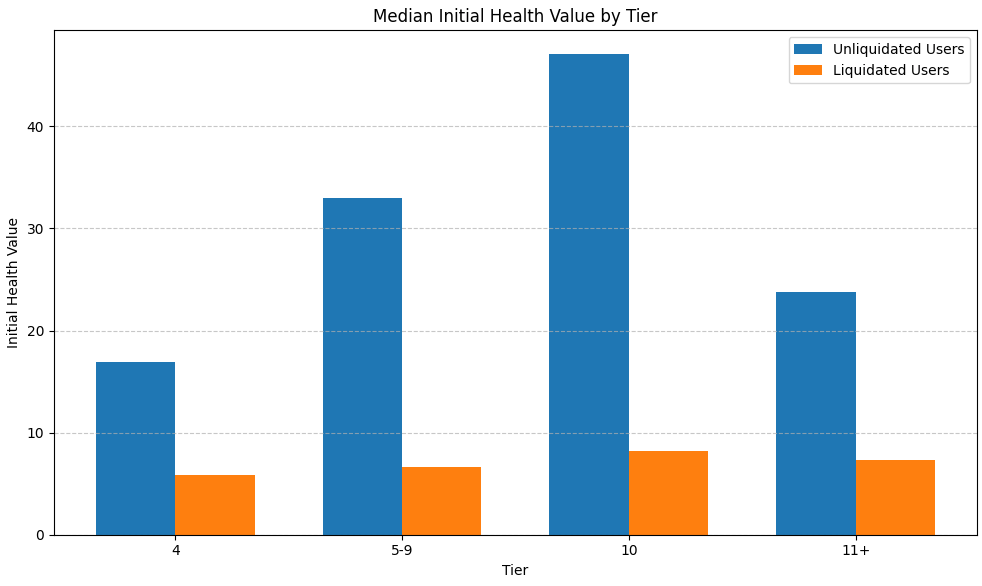
More instructive is considering the collaterization level of the loan users did take out. Naturally, healthy users might adjust their position by borrowing or repaying after their initial loan is created. The chart nonetheless shows off the divergent stories between users with differing risk profiles.
Users who entered into the riskiest tiers also tended to start with riskier positions
Users who got liquidated nearly all started with risky positions
In other words, if you play with fire you are more likely to get burned…
5. Liquidations by Initial Health
We’re unsatisfied with this histogram, but publish or perish...
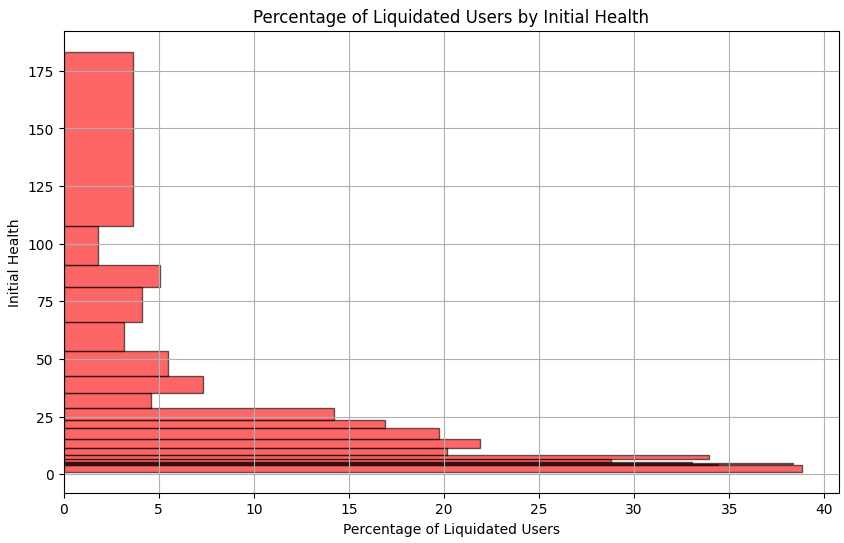
Here we bin users into 20 bins, with an equal number of loans in each bin.
Along the y axis you see the initial health of the loan.
The x axis shows the percent of loans in this bin that ended in a liquidation (self-executed or otherwise).
As is made quite clear, users who start their loan with an initial health factor above 30 usually don’t ever get liquidated. The chart from the prior section also shows that such loans are very likely to select a safer range of n>4
Discussion
The results here are quite preliminary and fall short of reviewing the most pertinent questions:
How do similar health loans perform at different numbers of bands (n)
How do behaviors and outcomes vary based on whether users select to use “leverage”
How do behavior and outcomes vary between Curve lending platforms and other lending markets.
What is the mean duration loan time and fate for loans that enter soft liquidation, by number of bands (n)
The final question is rendered more complicated by the effect of active loans in soft liquidation, as opposed to simply loans which already ended. The work of Braun and Schweidel in modeling customer churn behavior may be instructive and applicable toward modeling liquidation probabilities and therefore estimating loan duration by number of bands.
Some consideration need also be given to measuring duration from a consistent starting point, given that loans at n=4 often tend to max borrow, while loans at n>4 tend to over-collateralize. It is possible with the attached data to determine the rough time that a loan enters “soft liquidation” as a uniform starting position, although it’s an open question whether one should count the first time or last time a loan enters into soft liquidation when it moves actively. Also, the effects of changing collateral positions must be handled consistently.
Above we discussed several sources of bias:
Differences between crvUSD markets and Llama Lend markets (duration, market types, access to leverage)
Behavior (did users actively manage their loan)
Another source of bias is “survivorship bias.” About 70% of users only take out one loan. The remaining 30% take out more.
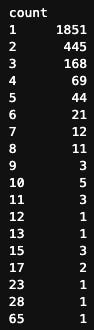
One user took out 65 loans, and needless to say they were not all successful. Since this dataset aggregates by individual loans, not users, it slightly overweights the behavior of users who suffer several liquidations.
Behavior may also biased by gas costs, as we did not consider Arbitrum, and the bulk of the loans occurred on crvUSD, not Llama Lend.
