July 25, 2022: $100MM in Fees 💰💱
Commemorating a Milestone with a Deep Dive into Curve Trading Fees
veCRV holders, it’s time to celebrate a big round base 10 number!
$CRV Fundamentals
A $CRV token pretty much has two fundamental sources of value: trading fees and governance.
Governance value most directly can be represented as income paid directly to holders of veCRV to influence Curve votes (aka bribes or birbs). It’s difficult to pull numbers on this governance value, because this activity flows through several different bribe sources in a free market ebb and flow. Anecdotally, though, veCRV holders are generally pleased with this income.

The other portion of $CRV revenue comes from trading fees, earned every time somebody makes a transaction on Curve. This is easier to account for, because it’s paid out weekly through one source. The best place to review this activity is directly on Curve.
Nonetheless, some popular services like Token Terminal and CryptoFees report these values wildly incorrectly.


It’s not necessarily a knock against these services… there’s a ton of information to aggregate. Everybody’s bound to make some mistakes in this fast moving space.
Just be aware you may gain an edge if you understand where information asymmetry exists in crypto. Reliance on faulty data has misled even the smartest traders. If you can better interpret reality than the pros, you may be able to leverage this to your benefit.


Generally speaking, if you need accurate data, we’ve found DeFi Llama’s team to be the most reliable, transparent, and quickest to make corrections.


In summary, the main points:
$CRV fundamental revenues are governance income + trading fees income
The latter is easier to retrieve data.
Curve Fees vs TVL
Curve fees by far do the best in periods of high volatility. Nearly every time there has been a major market nuke, Curve has approached records in trading fees. When the markets are quiet is when Curve tends to see trading fees calm down.
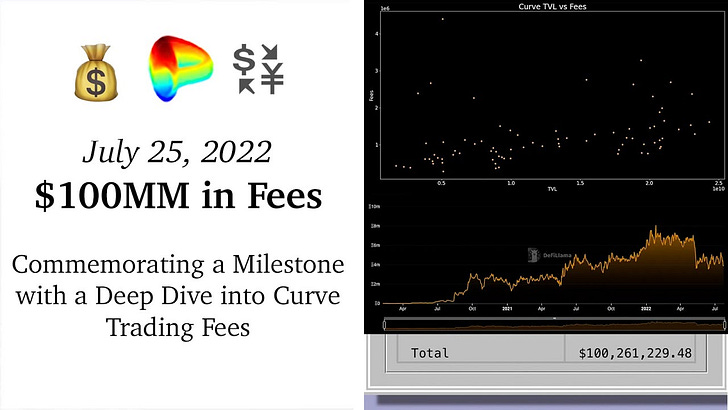
If you want a rough rule of thumb for ballparking Curve fees, you can use Curve TVL. Curve TVL and Fees are about 33% correlated, so while it’s not perfect, you can roughly eyeball the effect in this scatterplot of the two:
Agreed it’s a bit too loose, but this remains the best proxy I’ve found to date. Of course, this still depends heavily on volatility. Massive action even when TVLs are low will lead to big weeks.
How, then, might one predict Curve TVL?
We reviewed this a few weeks ago, when we found it’s easiest to simply estimate Curve TVL based on the dollar price of ETH. The TVL of Curve is about 91% correlated with factors like ETH price and 90% with BTC price, (the two of which themselves trade together in a close range).
You can observe this phenomenon yourself without need of running a Jupyter Notebook. Note how much smoother the DeFi Llama Curve TVL graph looks when denominating in ETH.
Note also how both charts somewhat resemble the ETH / USD price chart over the interval.
A portion of this phenomenon, but not the entirety, is explained by the fact that Curve has significant deposits in Ethereum and Bitcoin denominated pools. A drawdown in these prices will necessarily diminish Curve TVL.
Yet even if you redenominate Curve TVL in ETH terms to adjust for this effect, there’s still a curiously significant correlation with Curve TVL and ETH price (77% instead of 91%).
Our hypothesis: When crypto prices plummet, users withdraw deposits to cover margin call. When crypto prices go up, users lever up and put money in Curve.
Note, this all runs contrary to FUD-sters who posit, without evidence, that Curve TVL is a function of $CRV token price.
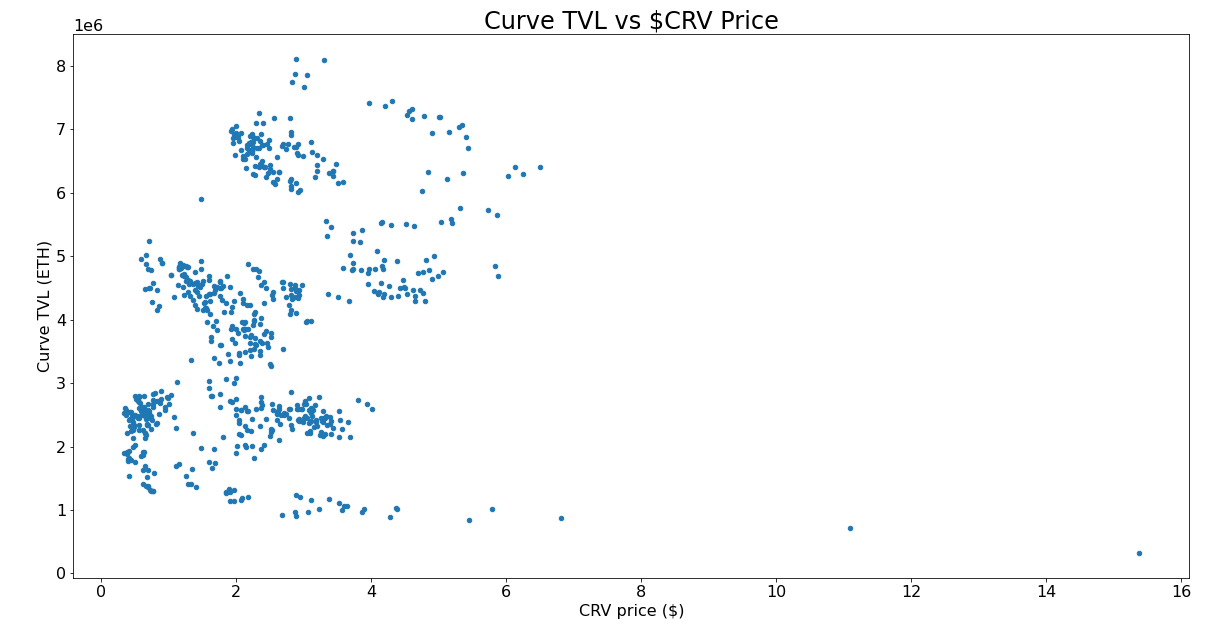
Curve TVL in dollar terms is more weakly correlated with $CRV price than $ETH price (55% as opposed to 91%). Redenominate TVL to ETH terms to knock out this volatility, and we observe a mere 17% correlation, relative to the aforementioned 77% for ETH prices:
You can extrapolate a trendline here, but it’s weak. If you tell me we’re at $2 CRV, we’re as likely to be sitting at 100K ETH TVL as we are 700K ETH TVL.
It also has less explanatory power than other variables, even other asset prices like BTC, CVX, FXS. Same plot as above for CVX price shows a somewhat clearer trendline (67% correlation).
Note this effect persists if you isolate to the same time window, in case you suspect that the early $CRV prices or recent trends caused skew.
v2 Effects
One final note on the trading fees. The effect of Curve v2 pools on trading fees are worth highlighting. Critics occasionally claim Curve to merely be a site for trading stablecoins, but recently we’re seeing signs that volatile v2 pools are flippening stablecoin volume:
The daily stats fluctuate wildly, but recently the “Crypto Volume Share” displayed on the homepage has lately spent more time north of 50% than south.
The effect here is easy to understand. Curve v2 pools have no external price oracle, but are rebalanced simply by internally inferring the price based on trading activity. When prices of volatile assets fluctuate, traders have a brief window to profit by arbitraging these Curve pools.
Traders earn free money as they rebalance the pool. In doing so, LPs earn trading fees. This requires no special action on Curve’s part. The effect continues forever, the pools can’t be killed. As long as they exist, some imbalance will build up as prices move, so incentive will always exist for traders to arb it back.
The result is Curve v2 pools often earn decent trading APYs due simply to arbitragers correcting prices. This happens as long as crypto prices remain in fluctuation, which happens quite frequently. In contrast, stablecoin pools may turn over less frequently.
This makes a worthwhile experience for LPs based on trading fees alone, even for pools without rewards gauges.
More v2 pools beget more volume begets more fees. It’s a virtuous cycle. See you in August!


