Wake up, 0xbabe… a new governance proposal just dropped, one which could allow speculators to bet on depegs of $sUSDe with up to 35x leverage.
The governance proposal explains it comprehensively and is the most recommended resource on the subject, but we’ll do our best to unpack the intricacies here.
Help us by sharing this thread on 𝕏
Pre-Requisites
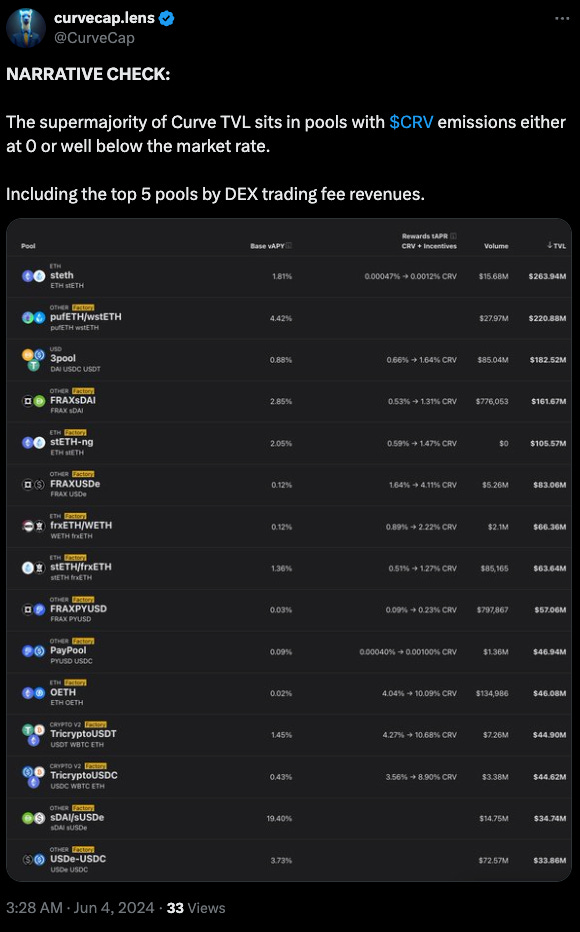
The screenshot above in the governance proposal shows off the successful Curve pool between sUSDe and sDAI. With both tokens natively earning interest, you can see the pool is quite successful, earning good money from trading fees.
The pool has grown to be quite successful, $35MM in TVL makes it the 14th largest Curve pool by TVL. Routine trading fees are sufficient to entice liquidity, so the pool is in the illustrious company of Curve pools that have no emissions (but don’t tell the haters).
If you’re putting together a checklist for how to create a successful Llama Lend market, it might look like the following:
Reputable collateral
Lots of liquidity
Good price oracle (ie NG pool)
Active arb traders
ASIDE: it may be a happy ending for at least most of the players in said FXN market, which did not have sufficient arbitrage trading on Arbitrum to keep the market healthy…
$sUSDe fits all the criteria. It has a lot of trading activity, and the $35MM Curve pool is sufficient liquidity, particularly considering the size of the current vaults are just a few hundred thousand.
In the UI you can see there have been two $sUSDe vaults launched so far, the newest one being the subject of the governance proposal with just some test liquidity. If you’re engaging with these vaults in the UI, exercise caution until such time as these markets are better distinguished:
Why there’s been little activity in the former pool? That’s a subject for a whole different article, but suffice to say it’s likely some combo of slow supply growth without incentives and the vault’s overall product market fit (ie nobody actually uses the $CRV short market when given the option, despite the boisterous ruckus of the death spiral sock puppet army.)
So the new $sUSDe market may well have a sufficient use case and actually see some pickup. Trading the frequent depegs of the oft-FUDded stablecoin with 35x leverage is a fairly attractive sales pitch.
Construction
With all the conditions necessary for a successful vault, there remains some legwork to get the new vault up and running. The choice of oracle is crucial to the success of these vaults as we’ve seen.
The simulations here looked at $sUSDe through the lens of the sDAI/FRAX pool because it has a lot of data to examine.
But in practice the new vault will operate against a brand new $sUSDe / $crvUSD pool, created two days ago and the recipient of $2.2MM in liquidity, to most streamline the operations.
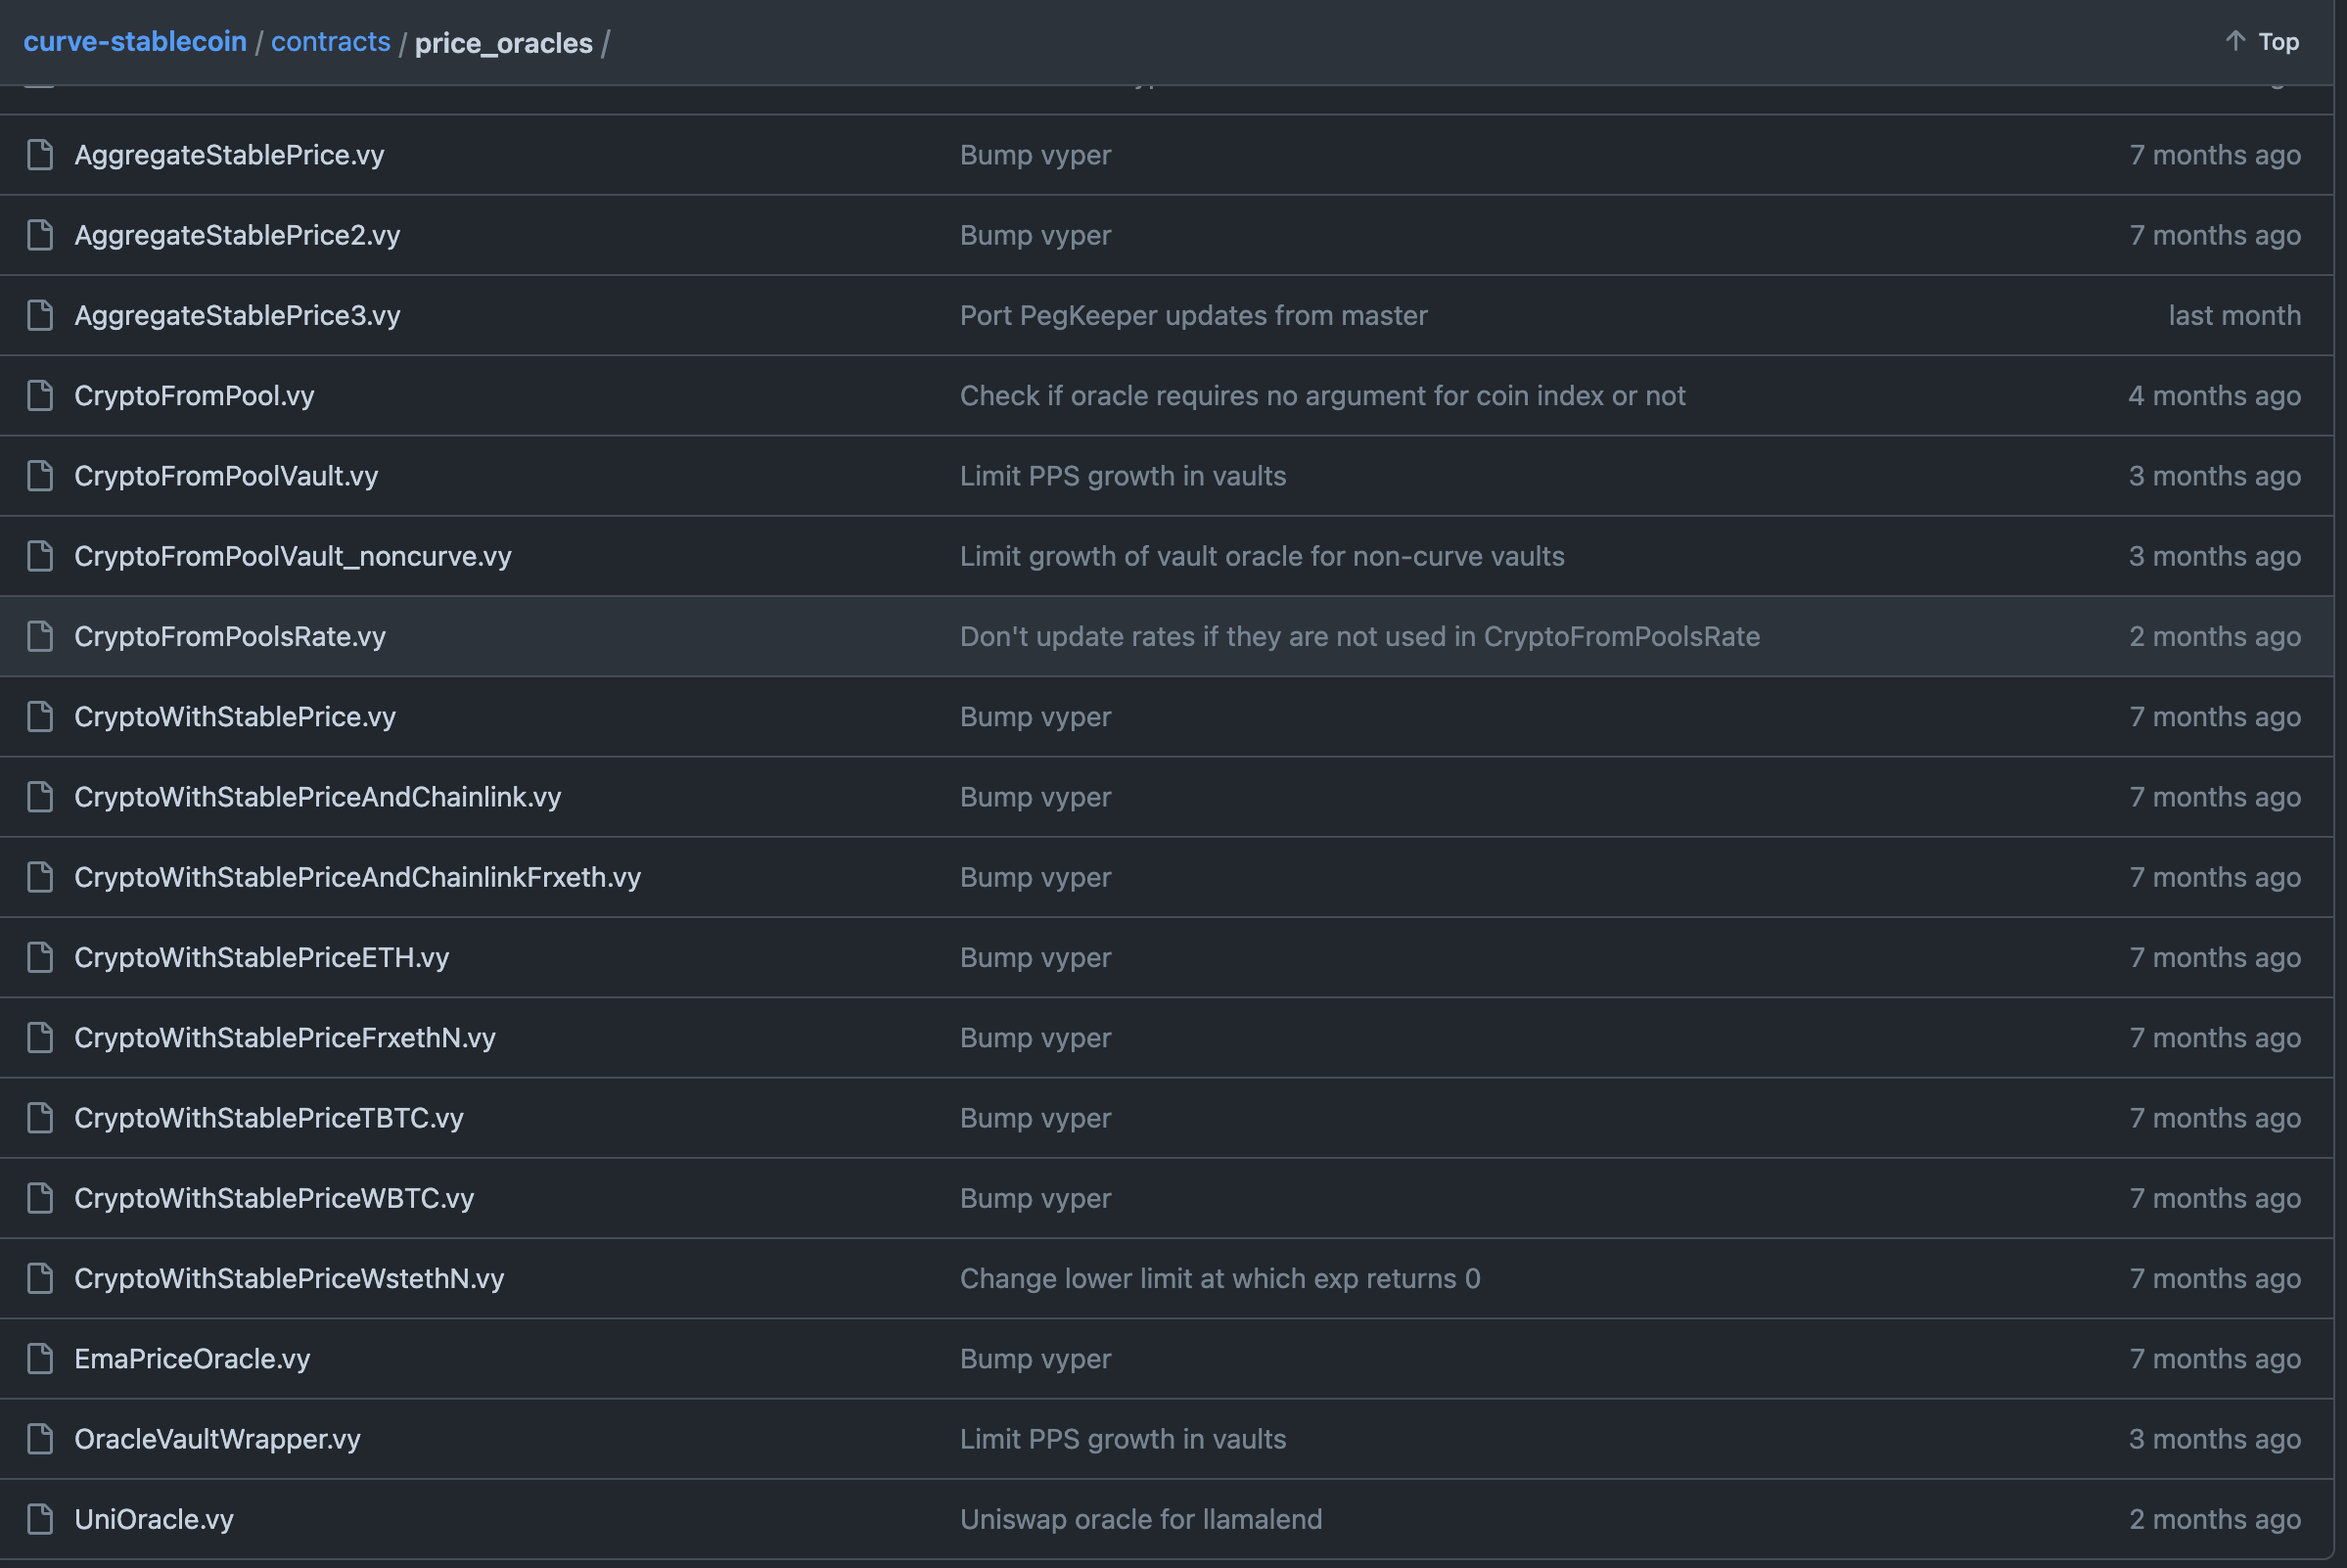
You can observe Curve has a variety of oracle designs to pick from for these vaults.
Even the non-technical readers can surmise that the sheer number of custom contracts being created here might all introduce a lot of opportunities for a minor error to creep in. Yet they also helps to contain any systemic risk if a particular oracle contract happens to to be buggy.
In this case, the CryptoFromPoolsRate contract is pointed at the new $sUSDe / $crvUSD contract, which periodically reads and caches its stored_rates function for price calculations.
The final step is to plug it all into simulations and see how it might behave.
The Simulation
It looks like a lot, but in fact these simulations are simple enough you can replicate at home.
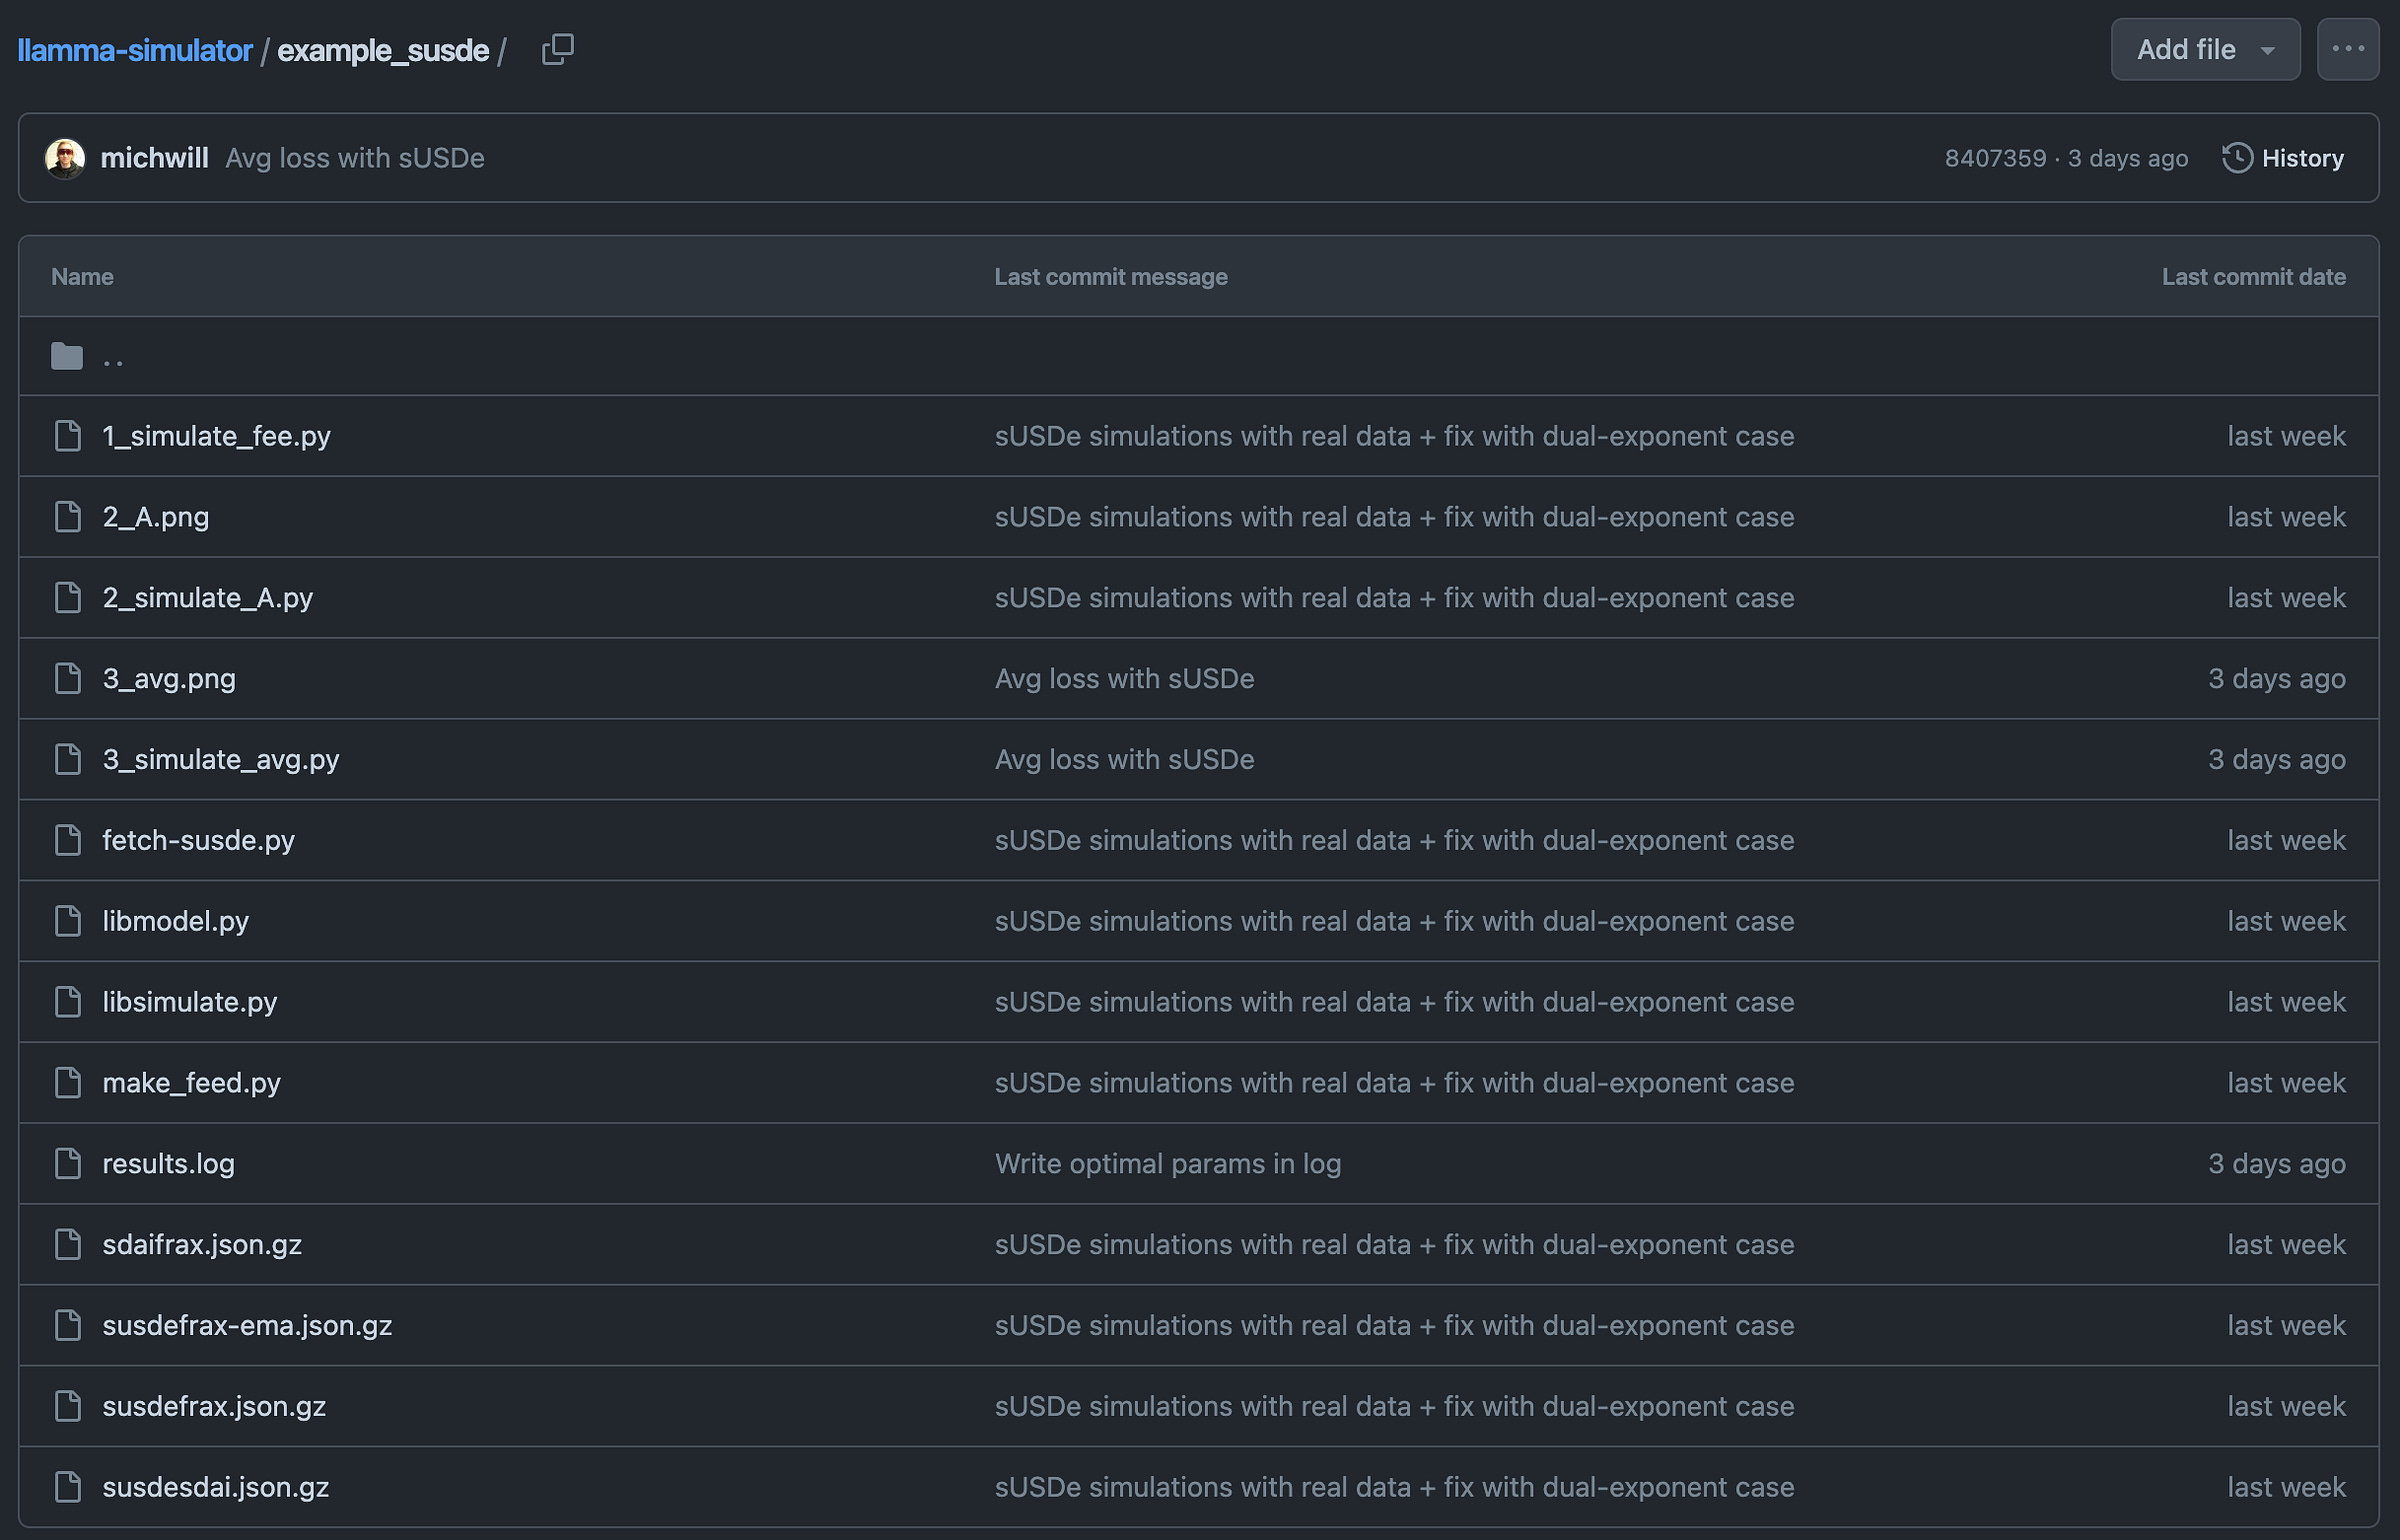
There’s a lot of .gz files containing the zipped results of scraping historical price data via the fetch-susde.py script which generates three of these by sweeping through price history of:
$sUSDe → $sDAI
$sDAI → $FRAX
$sUSDe → $FRAX
Armed with real historical data, we can use it to generate the nice charts using the libsimulate.py library.
The charts included in the post are the interesting ones. The simulate_A script sweeps over possible A parameters to look at possible losses.
The lines in the output chart are not labelled, but you can see intuit what it represents from the scan_param function.
The resulting graph:
Interpreted, you can see the x axis sweeps along possible A values, while the y-axis shows the results of the simulations:
Orange: losses
Blue: discounts (ie liquidity adjusted loss), calculated based on losses and the
bands_coefficientin the simulation
From the results.log file you can see the raw output
You can see losses get minimized around A=200, which gets adopted into the final architecture.
This is fed into the calculation posted in the proposal:
If you’re puzzling over the 0.96% as I was, try subtracting liquidation discount from loss from the results file…
Plugging all the results into 3_simulate_avg.py sweeps over loan values of n, from the riskiest n=4 at the left to the safest n=50 at the right
Implying that at max leverage, losses would be in the ballpark of 0.025% per day
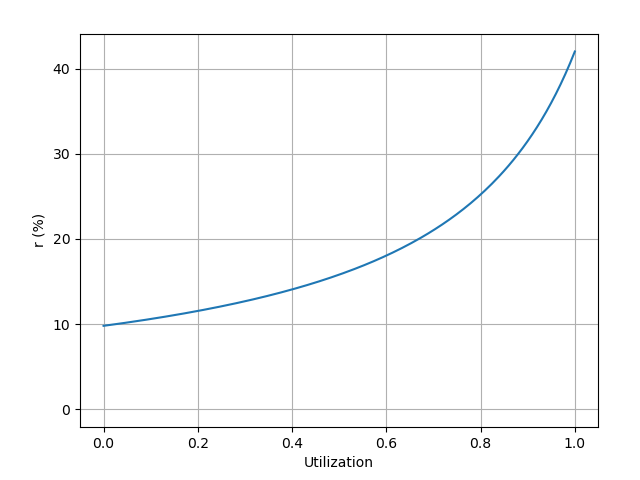
Finally, the utilization simulation is added to a different repository
You can see the target rate (r0) is set to 28%, representing the current $sUSDe rate, at an x value (vault utilization) of 85% (u0).
When this market is not utilized at all, the market will charge an interest rate of just 10%. We won’t tell you what to do in those circumstances because we don’t offer financial advice here…
Plot the history (not included in the repo), and you can see the history of $sUSDe according to the EMA oracle.
A touch more graceful than Economy 1.0
For more on Ethena, master of the battle cry, check our prior article on the subject


